Most Vulnerable
The most vulnerable subscriptions, assets and products are shown based on the number and severity of the vulnerabilities detected. The top five of each item are shown and more can be seen by clicking the double chevron at the bottom of the panel. To drill down into more details on a particular subscription, asset or product click on its name. To filter the dashboard based on a particular subscription, asset or product click the filter icon that appears when hovering over the name.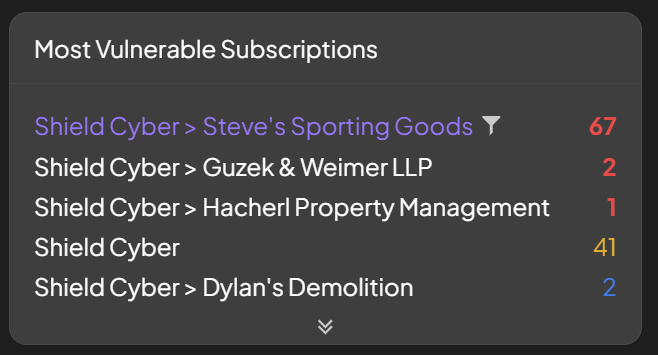
Filtering
By default there are no filters and the platform is showing information across all subscriptions, assets, products and vulnerabilities. As you drill down into a particular item a filter will be automatically set. For example if you click on a subscription from the most vulnerable subscriptions panel, a subscription filter will be applied. To search for a specific item, start typing its name and select from the auto-completion drop down that will appear. To remove a filter click into the associated text box and click the X at the end.
Recommendations
Our top recommendations for improving the security posture across your subscriptions will be listed organized by products that need to be patched. The top five recommendations are shown and more can be seen by clicking the double chevron at the bottom of the panel. There is information about the number of affected assets, subscriptions and vulnerabilities tied to each product. To drill down into the recommendation, click on the product, asset count, subscription count or vulnerability count. As an example, to see which assets are affected by the vulnerable product, select the number of assets.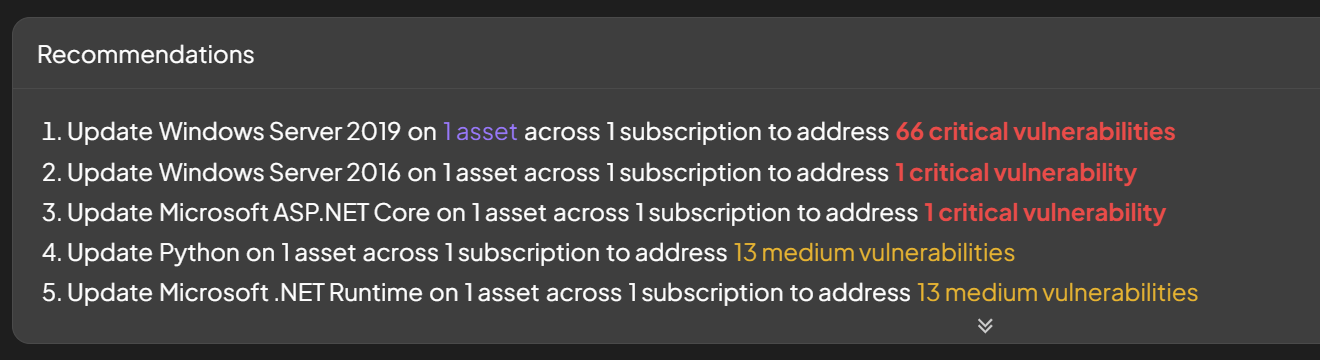
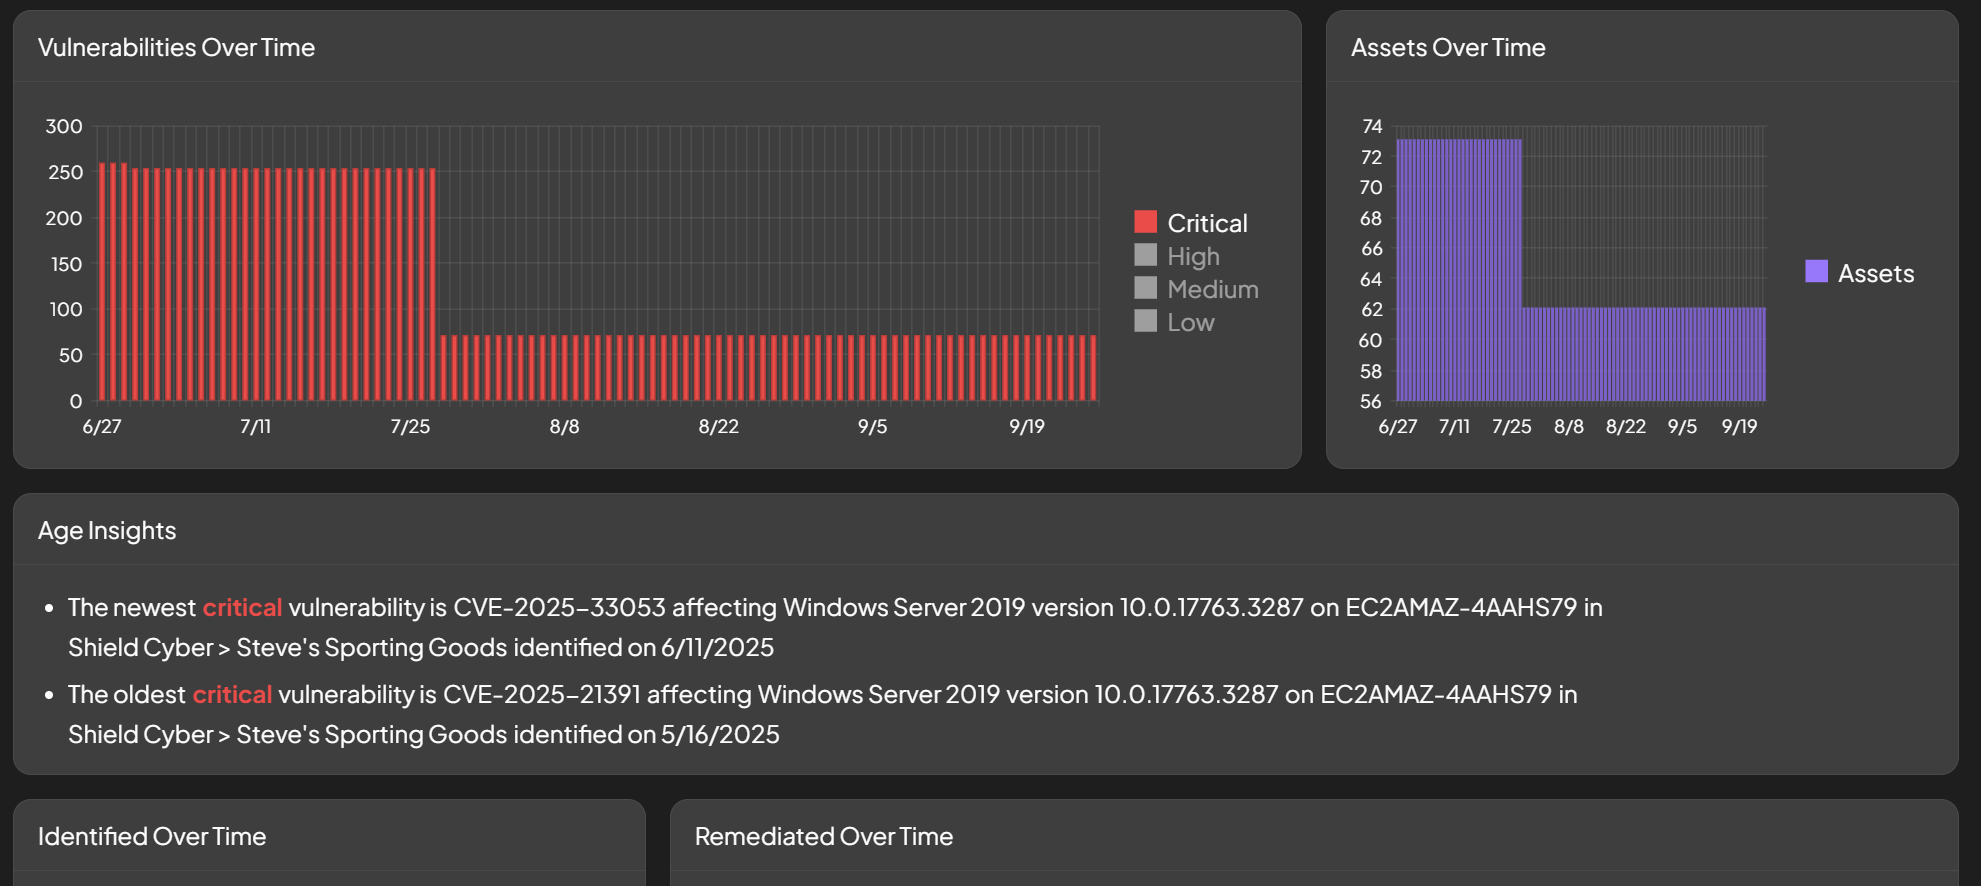
Trends and Insights
Several trends and insights are shown to provide more context on the security posture of your subscriptions.