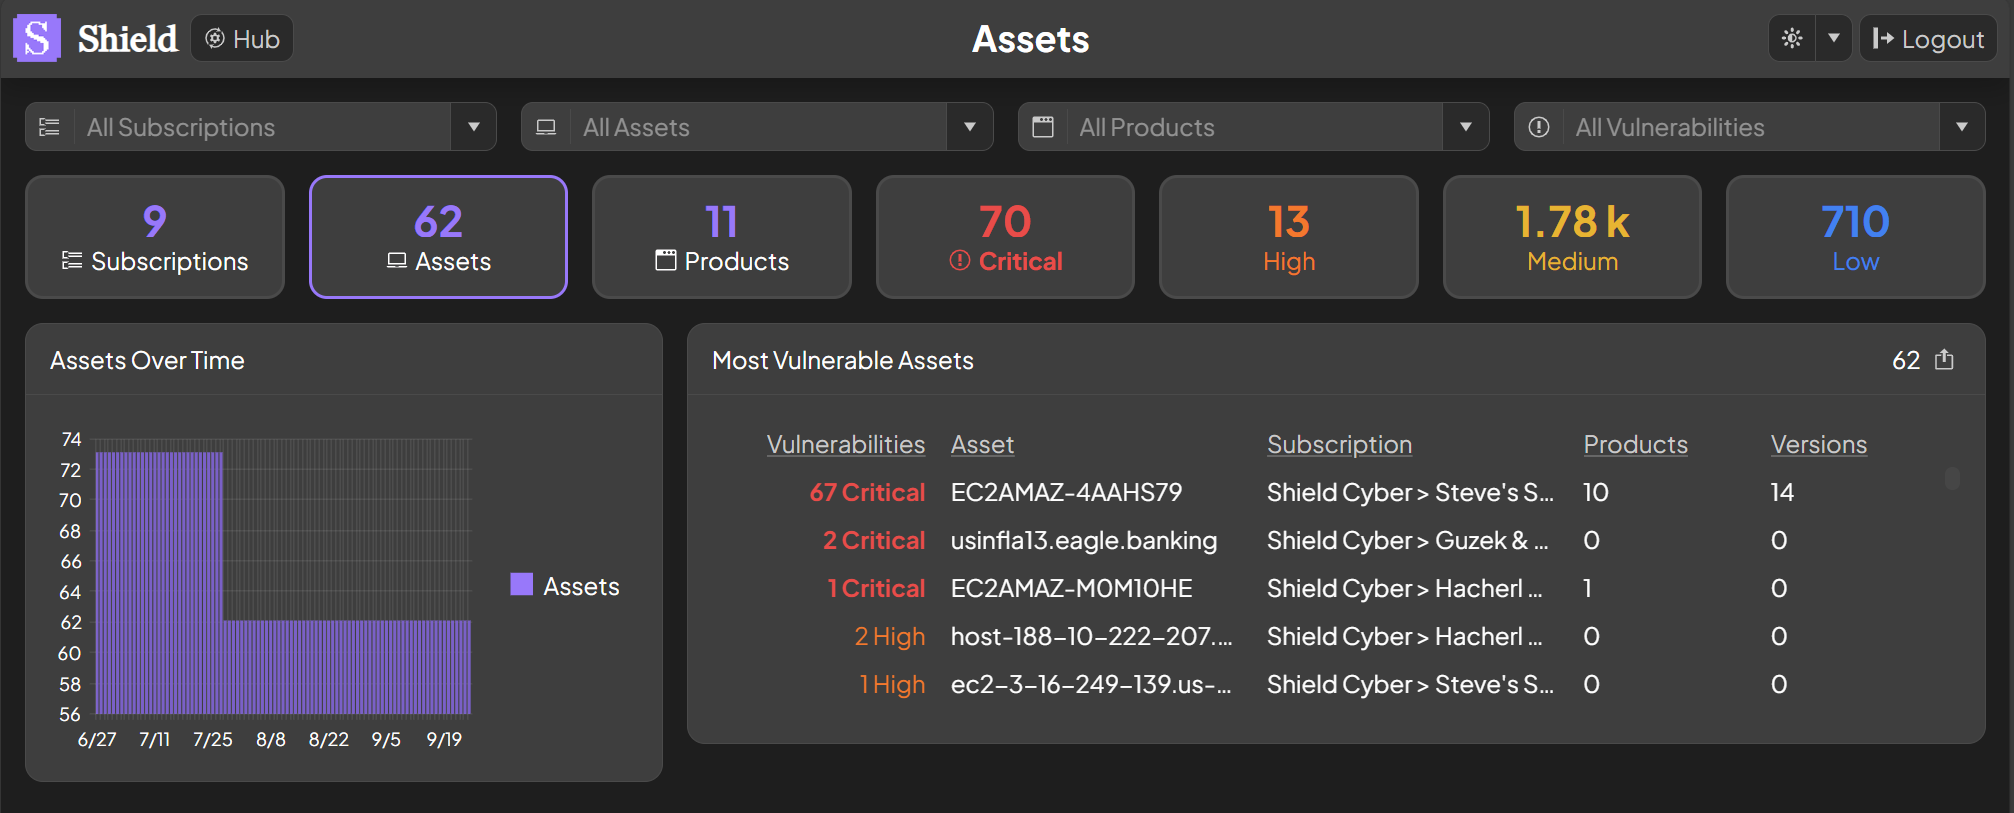
Assets Over Time
The assets over time chart will show how the number of assets are trending over the last 90 days.Most Vulnerable Assets
The most vulnerable assets are shown based on the number and severity of the vulnerabilities detected. The vulnerabilities, products and versions are rolled up by default. To break down by one or more of these dimensions, click on its respective number. As an example, to break down by products click on a product count. To drill down into an individual asset, click on its name.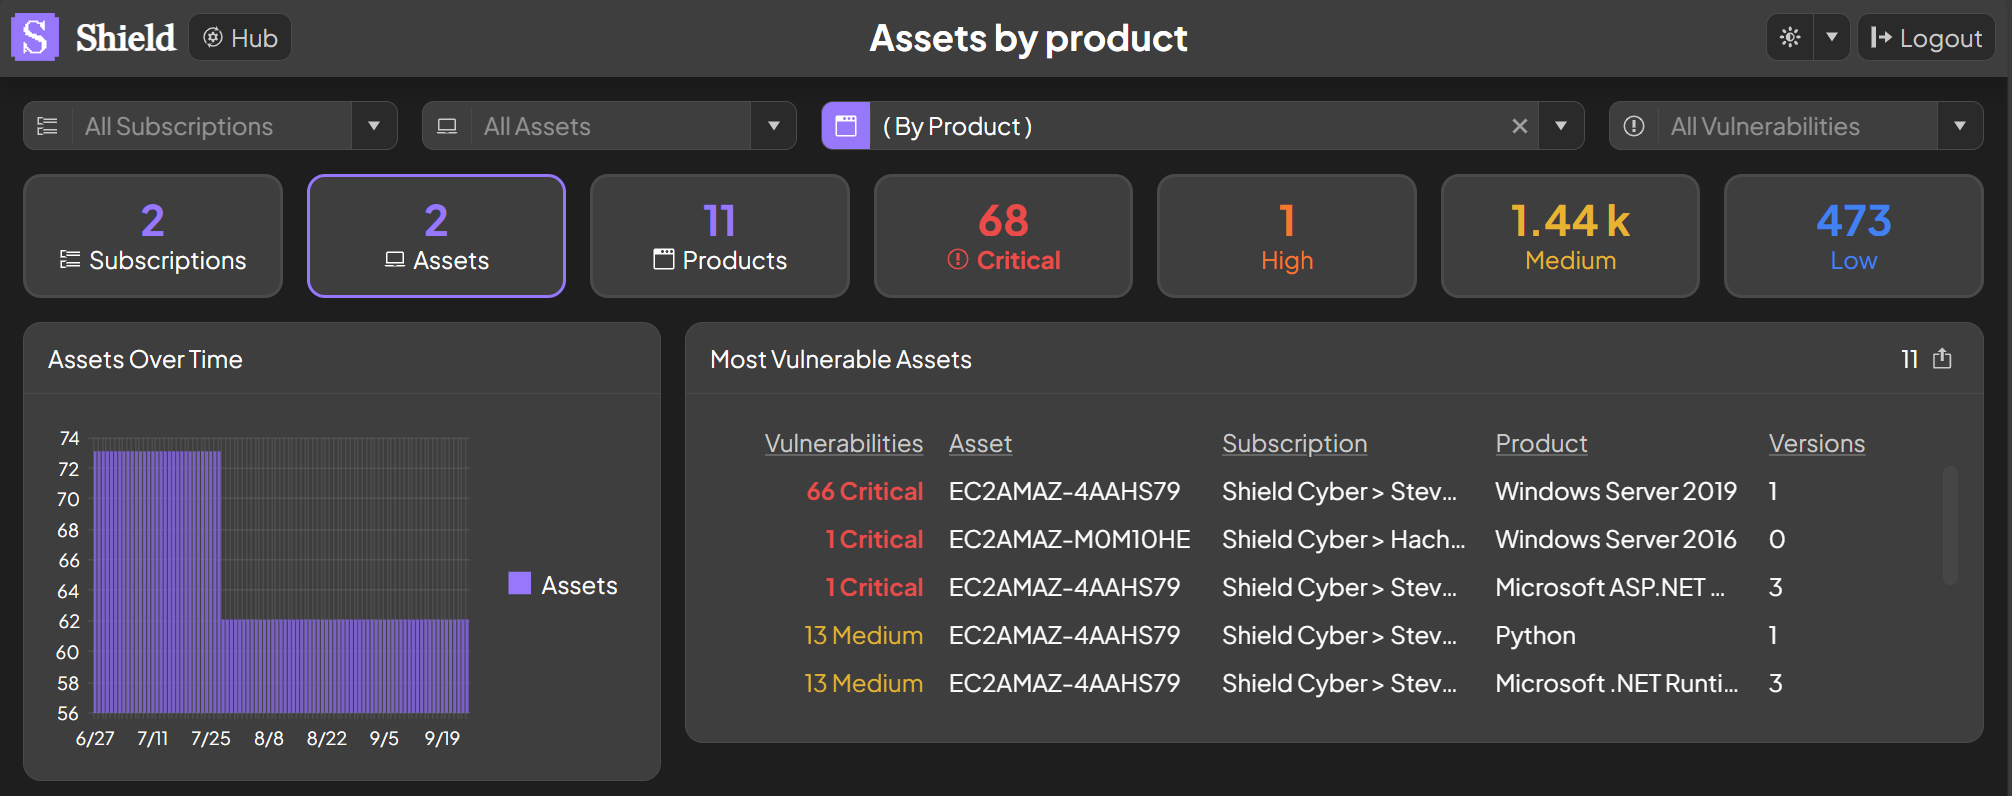
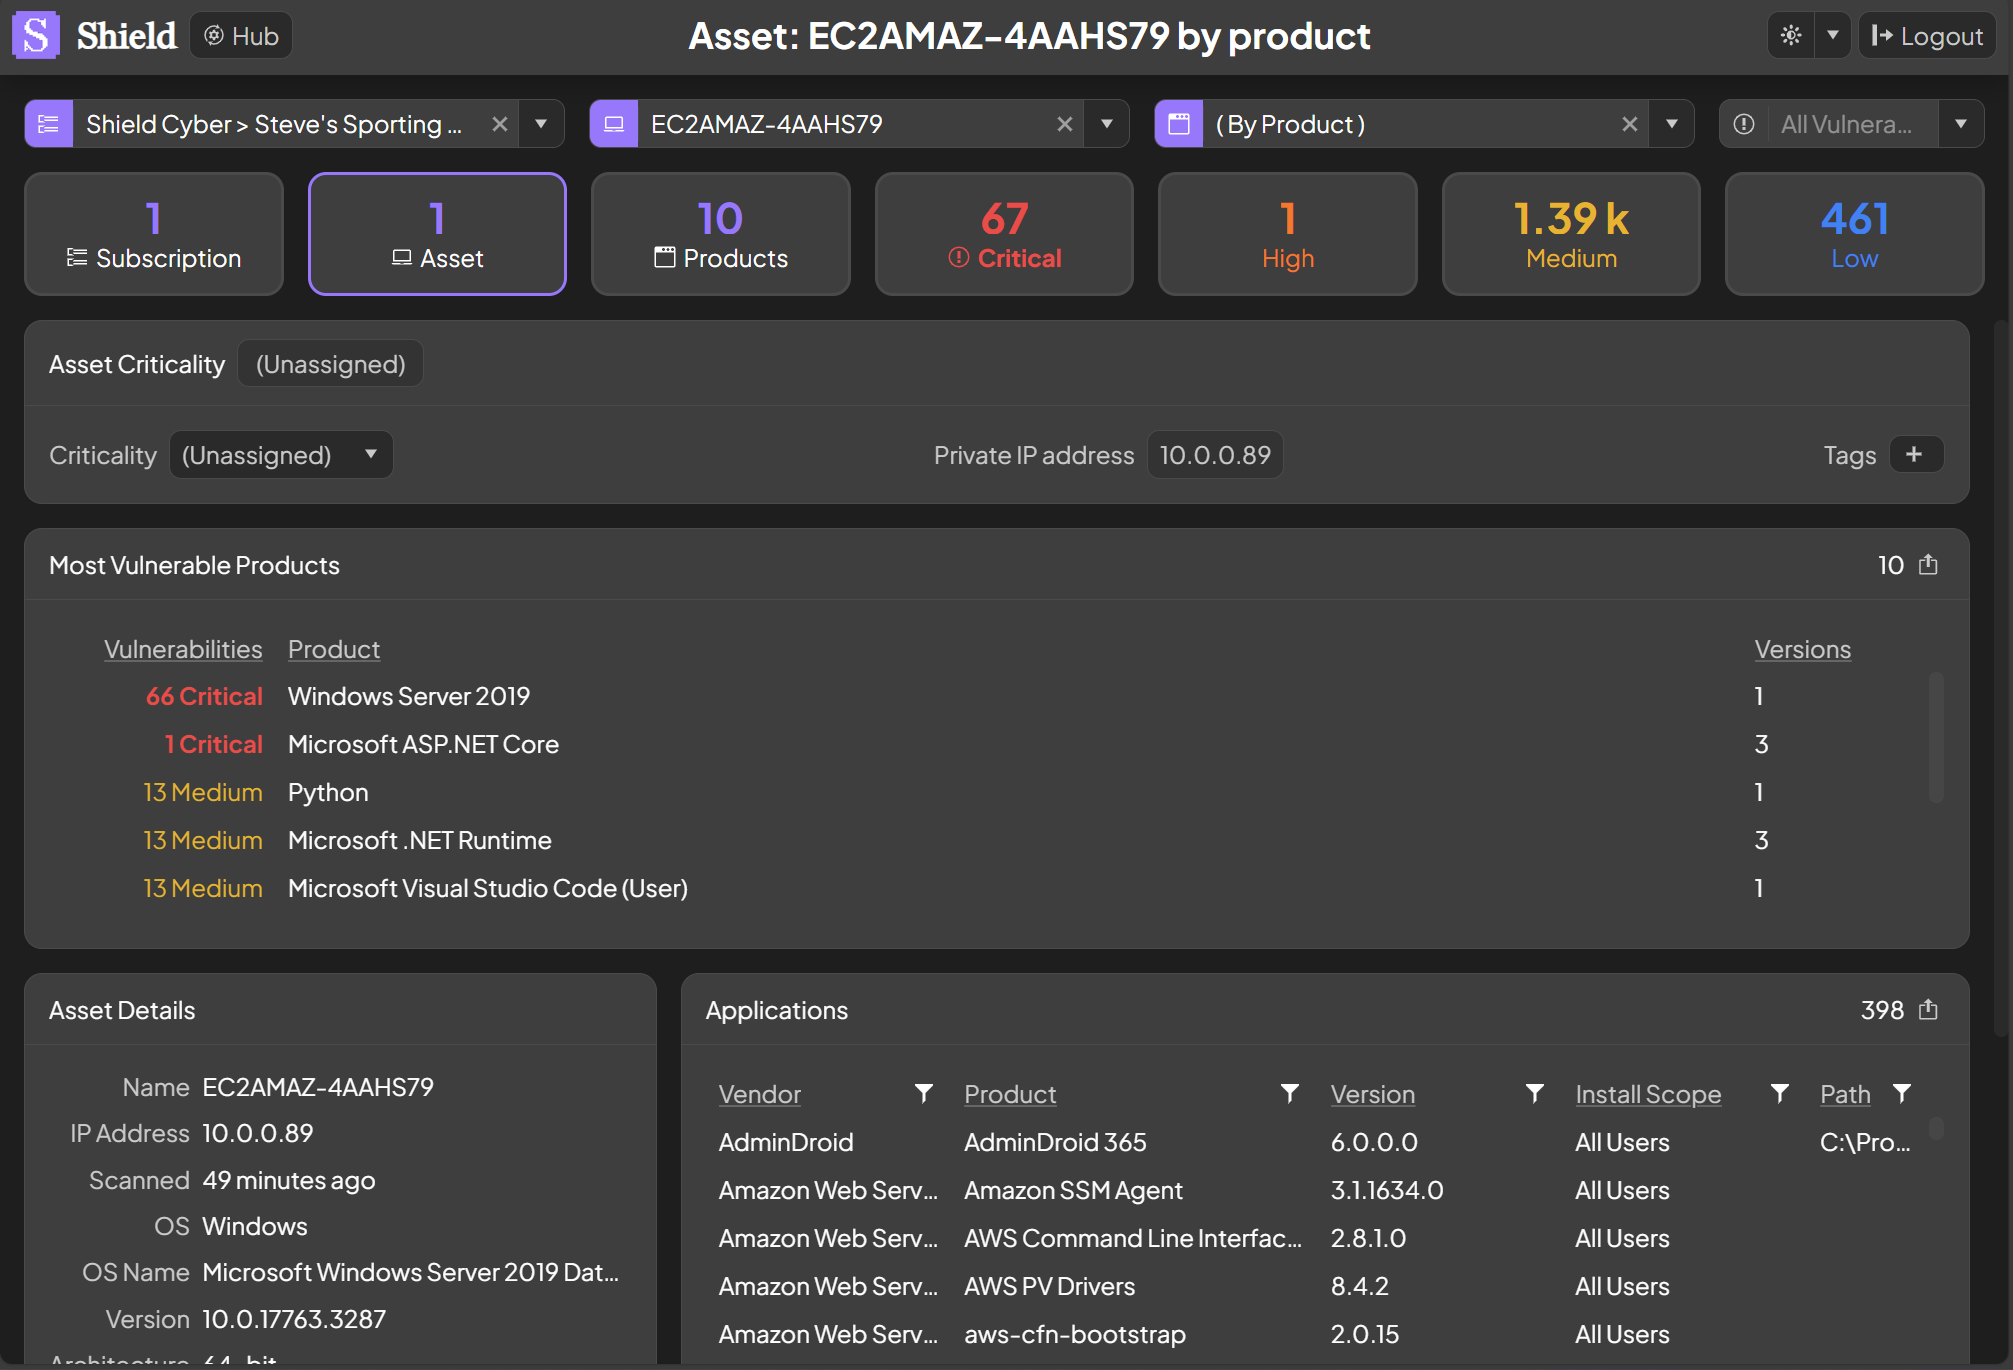
Invididual Asset
When an individual asset is selected, its criticality, most vulnerable products, details, applications and OS details will be shown.